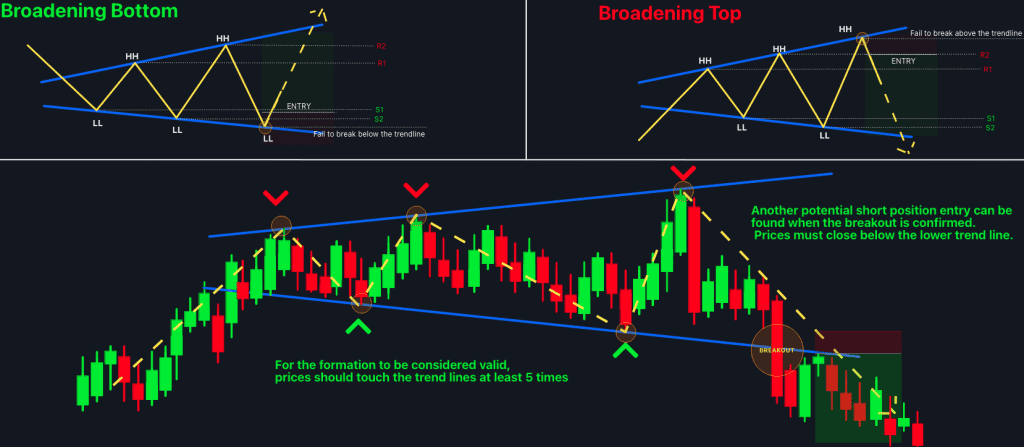
Markets don’t often turn without clues. Before an uptrend turns bearish or a downtrend comes to recover, price will often form recognisable chart formations.
These patterns help traders to detect potential trend reversals early, allowing them to better plan their entries, exits and risk management.
Learning these reversal chart patterns is not a guarantee of success for traders, but it does provide a better probability-based framework for making informed decisions. In this guide, you will learn the most reliable chart formations that give you warning before a trend breaks and how to trade them with confidence.
Why chart formations matter in technical analysis
Chart patterns are the changing battle between buyers & sellers. As a trend matures, the momentum slowly recedes. This change builds repetitive price patterns that have been observed for decades in all financial markets.
Seeing these patterns helps traders to:
- Spot potential trend reversals
- Better timing of trades
- Improved risk management
- Market Sentiment confirmed
- Do not enter trades too late.
- Rather than predicting the future, chart formations reveal what the market is likely preparing to do next.
Common chart formations that warn of trend breaks
The market usually leaves visual clues on the price chart before a trend reverses. By identifying these chart patterns, traders can anticipate likely trend breakouts, confirm reversals and trade with increased confidence.
Head and Shoulders
The Head and Shoulders pattern is made up of three peaks, with the middle peak higher than the other two. It shows buying momentum is fading, and a break under the neckline confirms a possible bearish trend reversal.
Inverse Head and Shoulders
The Inverse Head and Shoulders pattern appears after a downtrend and features three troughs with the middle one being the lowest. A breakout above the neckline would indicate that buyers have taken control and a bullish reversal may be on the chart.
Double Top
A Double Top is when price tests the same resistance level twice and can’t break higher. If support is broken, it means the buyers lost momentum, and a downward trend may start.
Double Bottom
When price tests the same support level twice without making a new low, a Double Bottom is formed. A breakout above resistance confirms new buying strength and signals a potential bullish reversal.
Rising Wedge
A Rising Wedge consists of converging upward-sloping trendlines where price continues to rise despite weakening momentum. A break below the lower trendline often confirms a bearish reversal.
Falling Wedge
In a Falling Wedge, the pattern forms in between narrowing downward-sloping trendlines as selling pressure gradually fades. If it breaks above the upper trendline, it suggests buyers could be taking charge.
Rounding Top
A Rounding Top is formed slowly after an uptrend, as a rounded curve that indicates a decline in buying momentum. If prices break below support, it is often the beginning of a downtrend.
Rounding Bottom
A Rounding Bottom is a U-shaped curve that occurs after a downtrend and shows a slow accumulation of buyer interest. But once it breaks above resistance, this confirms the start of a potential bullish trend.
Final thoughts
Chart formations provide valuable insight into changing market sentiment before major trend reversals occur. Patterns like the Head and Shoulders, Inverse Head and Shoulders, Double Top, Double Bottom, and Wedge formations help traders recognise when buyers or sellers are beginning to lose control.
No chart pattern works completely all the time, but when combined with volume, support and resistance levels and technical indicators, you can get a big edge in your trading. So the key is to be patient, wait for confirmation, and manage risk well.
By mastering these reversal chart patterns, you’ll be better prepared to identify trend breaks early and make more confident trading decisions.